The US Dollar pulled back after touching a 3-month as the S&P 500 launched a recovery, denting demand for the go-to safe haven currency.
THE TAKEAWAY: The US Dollar pulled back after touching a 3-month as the S&P 500 launched a recovery, denting demand for the go-to safe haven currency.
US DOLLAR TECHNICAL ANALYSIS– Prices pulled back toward support at 9993, the 23.6% Fibonacci retracement reinforced by a rising trend line set from the October 17 low. A break below this barrier targets the 38.2% Fib at 9945. Near-term resistance is at 10071, the November 16 high, with a reversal above that targeting the 38.2% Fib expansion at 10123.
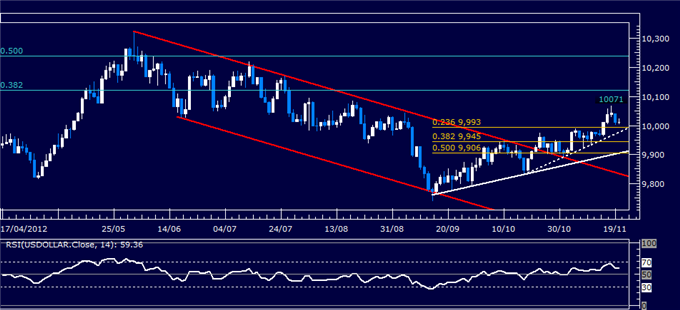
Daily Chart – Created Using FXCM Marketscope 2.0
S&P 500 TECHNICAL ANALYSIS – Prices rebounded as expected after completing Bullish Engulfing candlestick pattern. The bulls now aim to challenge the 38.2% Fibonacci retracement at 1392.80, with a break above that exposing the 1400 figure and the 50% level at 1408.50. Near-term support is at 1373.40, the 23.6% retracement. A reversal back below that aims to challenge 1342.10, the November 16 low.
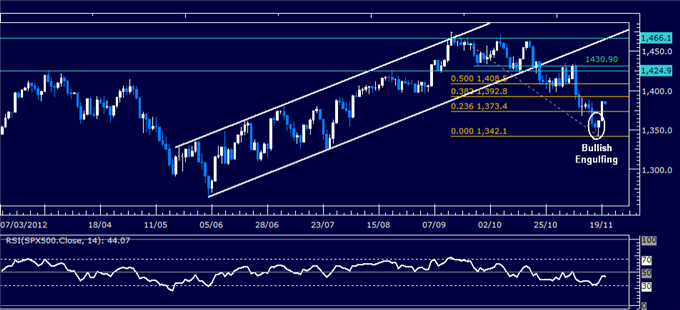
Daily Chart – Created Using FXCM Marketscope 2.0
GOLD TECHNICAL ANALYSIS – Prices are testing resistance at 1737.28, the 23.6% Fibonacci retracement. A break above that targets the 1790.55-1802.80 area. Near-term support lines up at 1701.09, the 38.2% Fib. This is reinforced by the 1700 figure and a rising trend line at 1687.69. A push below the latter level exposes the 50% retracement at 1642.57.
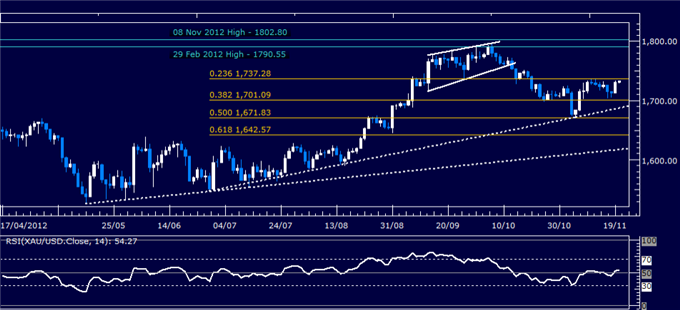
Daily Chart – Created Using FXCM Marketscope 2.0
Want to learn more about RSI? Watch this Video.
CRUDE OIL TECHNICAL ANALYSIS– Prices pushed above resistance at 87.70, the 38.2% Fibonacci expansion, exposing the 90.00 figure and the 23.6% level at 92.53. A further break above the latter level aims for a longer-term trend line resistance now at 95.75. The 87.70 level has been recast as support, with a reversal below that exposing the 50% barrier at 83.79.
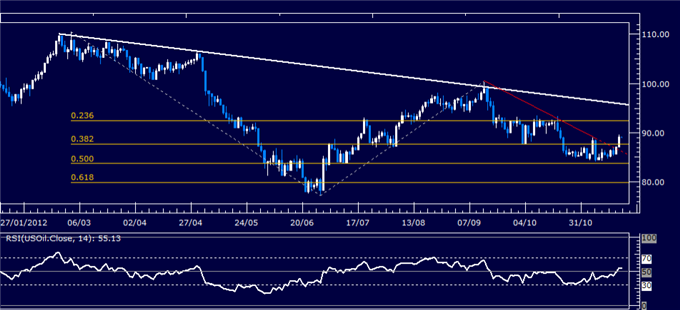
Daily Chart – Created Using FXCM Marketscope 2.0
— Written by Ilya Spivak, Currency Strategist for Dailyfx.com
To contact Ilya, e-mail ispivak@dailyfx.com. Follow Ilya on Twitter at @IlyaSpivak
To be added to Ilya‘s e-mail distribution list, please CLICK HERE
This article (Forex Analysis: Dollar Pulls Back from 3-Month High on S&P 500 Bounce) was originally developed by and is property of American Banking News. Checkout American Banking News for up-to-date banking news and peer to peer lending news.